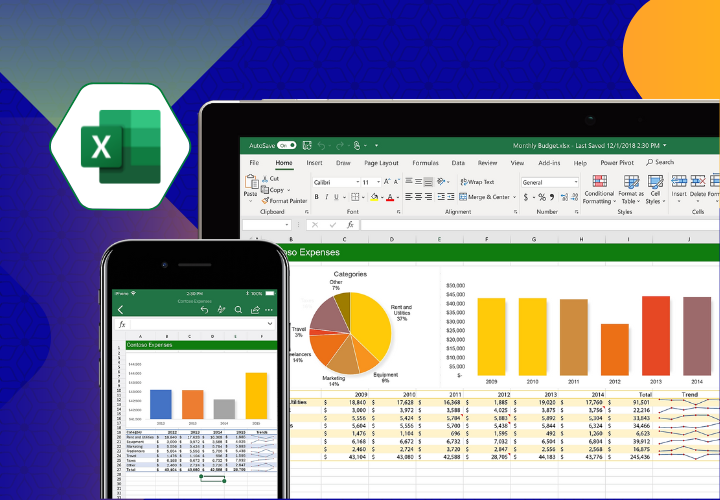
Data visualization with Microsoft Excel
in Microsoft Excel Essentials
5.00
(1 Ratings)
Created by
THOMAS FESTUS CUDJOE
About this course
Data visualization by FestMan Learning Hub
Comments (0)
Practice Files
1 Parts
Practice Files
Download the practice file and follow along with the videos.
3.91 MB MB
Showing Single values
3 Parts
Course Introduction
6.02 MB MB
Card visual
37.87 MB MB
Card Visual 2
20.70 MB MB
Visualizing categorical data
4 Parts
Visualizing Categorical Data
11.26 MB MB
Bar and Column Charts
21.78 MB MB
Highlight Top N items on a chart
30.57 MB MB
Stacked Charts
20.29 MB MB
Showing trend
6 Parts
Introduction to trend analysis
10.21 MB MB
Line charts and formatting techniques
30.77 MB MB
Custom Line chart
21.43 MB MB
Area chart
10.02 MB MB
Combo Chart
21.73 MB MB
Lollipop chart
23.91 MB MB
Part to Whole
4 Parts
Introduction to Part-to-Whole visuals
6.46 MB MB
Pie and Doughnut chart
26.11 MB MB
Pie chart protips👌
13.58 MB MB
100% Stacked Charts
21.38 MB MB
Showing relationship
2 Parts
Scatter Chart
30.26 MB MB
Bubble Chart
38.55 MB MB
Others visuals
3 Parts
Funnel chart
22.74 MB MB
Map Visual
36.06 MB MB
Treemap and Sunburst
57.97 MB MB
SPARKLINES
1 Parts
Sparklines: Column, Line and Win/Loss
34.26 MB MB
CONDITIONAL FORMATTING
5 Parts
Highlight cell values
27.31 MB MB
Top/Bottom items
23.68 MB MB
Data Bars
35.76 MB MB
Color scales
40.68 MB MB
Icons set
45.50 MB MB

5.00
1 Reviews
Reviews (1)
Abdul- Rahman Amadu
11 Jan 2024 | 08:50
Reply
.png)


.png)